
Categories
Home SellersPublished May 13, 2026
What the Foreclosure Headlines Aren’t Telling You


Are rising foreclosure headlines a sign the housing market is heading for another 2008-style crash?
Not even close. While foreclosure activity has increased compared to the unusually low pandemic years, today’s market conditions look very different from what caused the housing crash more than a decade ago. Rising filings don’t automatically mean homeowners are losing their homes, and today’s homeowners are in a much stronger position thanks to record levels of equity.
Foreclosures Are Rising — But Context Matters
You’ve probably seen headlines saying foreclosure activity is up. Technically, that’s true.
According to ATTOM, foreclosure filings have increased year-over-year and have now risen for several consecutive quarters. On the surface, that can sound alarming. But the headlines often leave out one critical detail:
The foreclosure numbers from 2020 and 2021 were artificially low because of government foreclosure moratoriums during the pandemic.
That means comparing today’s activity directly to those years creates a misleading picture.
When you compare current foreclosure activity to more normal market years like 2017, 2018, and 2019, today’s numbers are still lower than what was historically typical before the pandemic.
In other words, the market isn’t crashing. It’s normalizing.
Today’s Foreclosure Numbers Are Nowhere Near 2008 Levels
One of the biggest misconceptions right now is that any increase in foreclosure activity automatically signals another housing collapse.
But the data tells a very different story.
During the housing crash, foreclosure filings skyrocketed because many homeowners owed more on their homes than the homes were actually worth. Home values dropped rapidly, lending standards had been extremely loose, and many buyers had little to no equity.
Today’s market is fundamentally different.
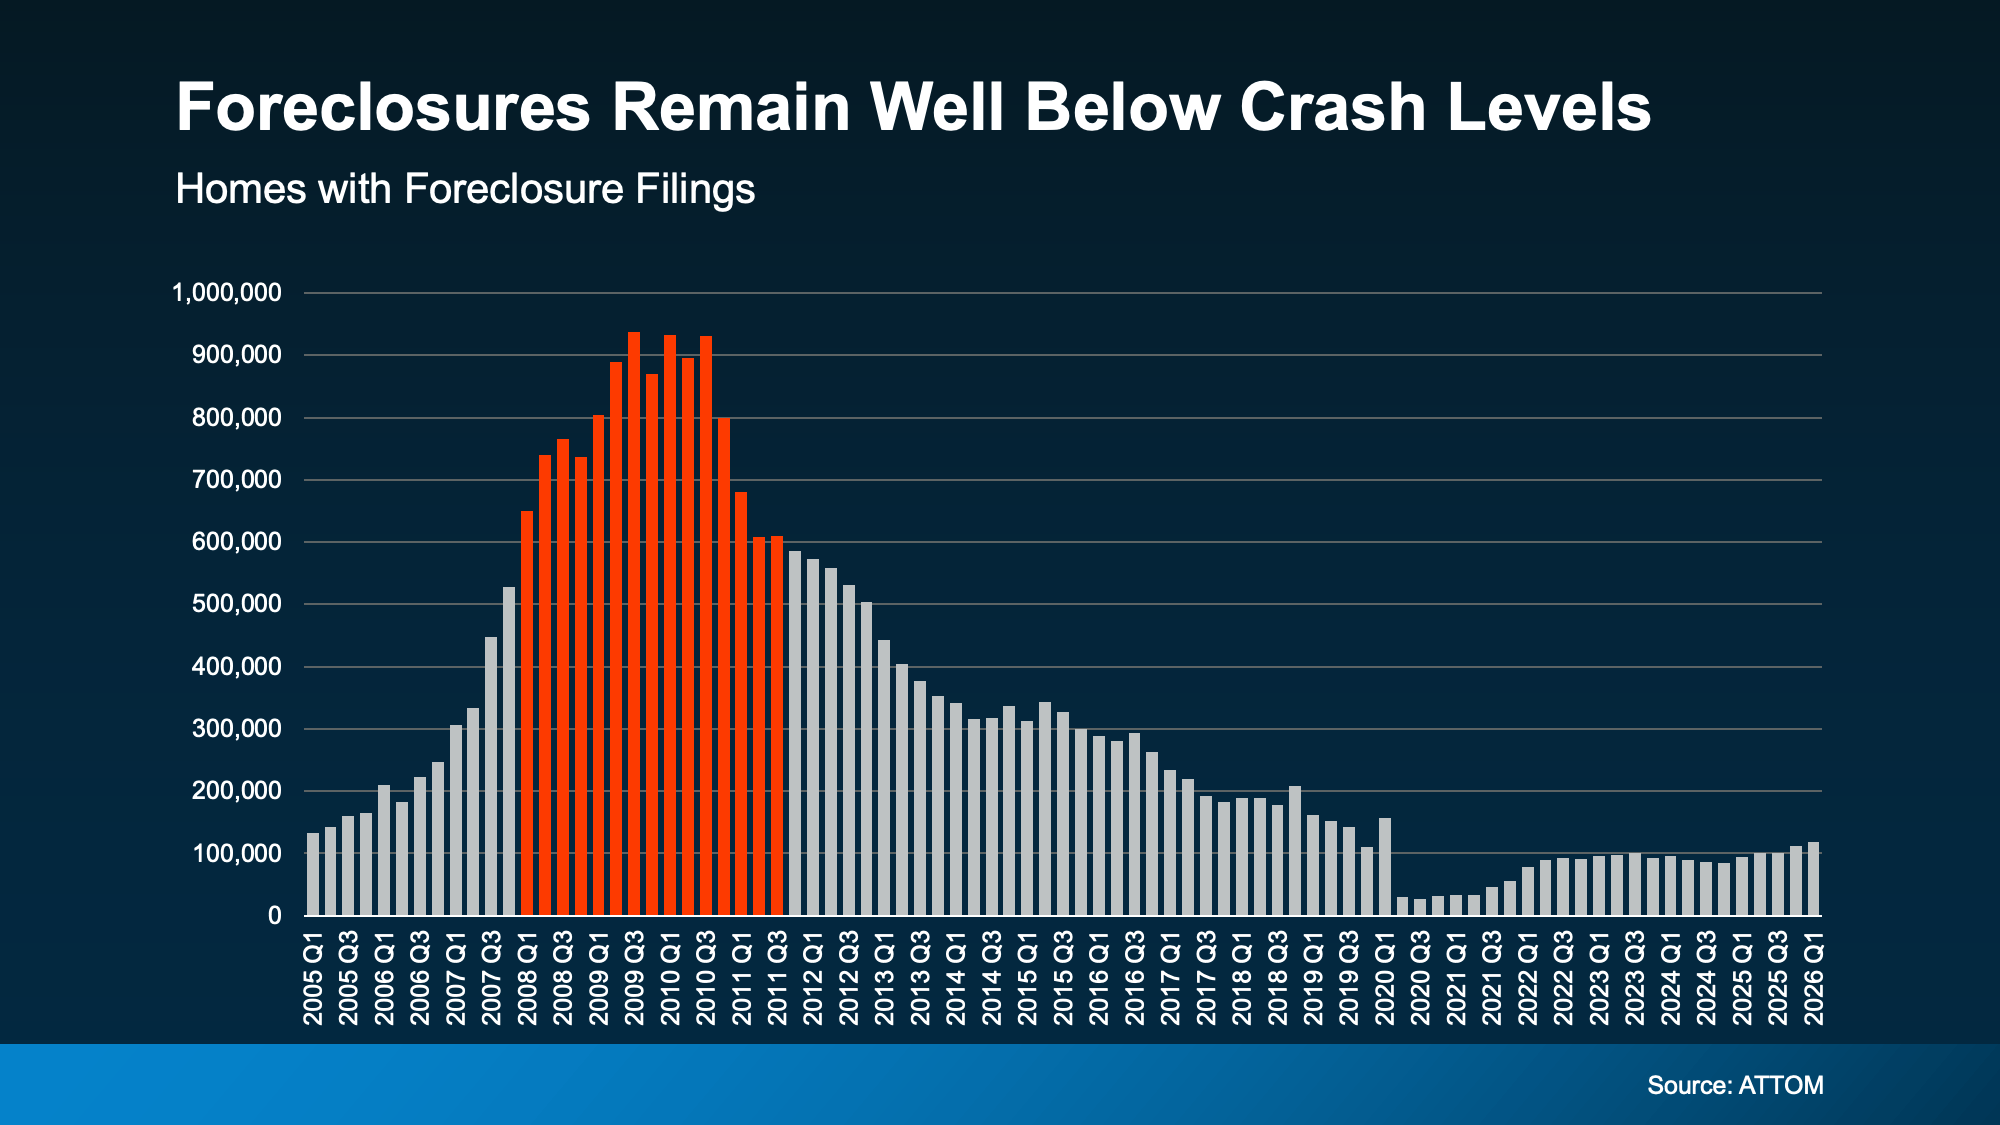
The chart below shows how foreclosure filings today remain dramatically lower than the levels seen during the Great Recession.
Even with recent increases, foreclosure activity remains well below the peak levels from 2008 through 2010.
Most Foreclosure Filings Never Become Completed Foreclosures
Another important detail many headlines leave out is this:
A foreclosure filing does not mean someone has lost their home.
There are multiple stages in the foreclosure process, and many homeowners resolve the issue long before foreclosure is completed.
The graph below helps explain the difference:
- Yellow line: Total foreclosure filings
- Orange line: Foreclosure starts
- Red line: Completed foreclosures
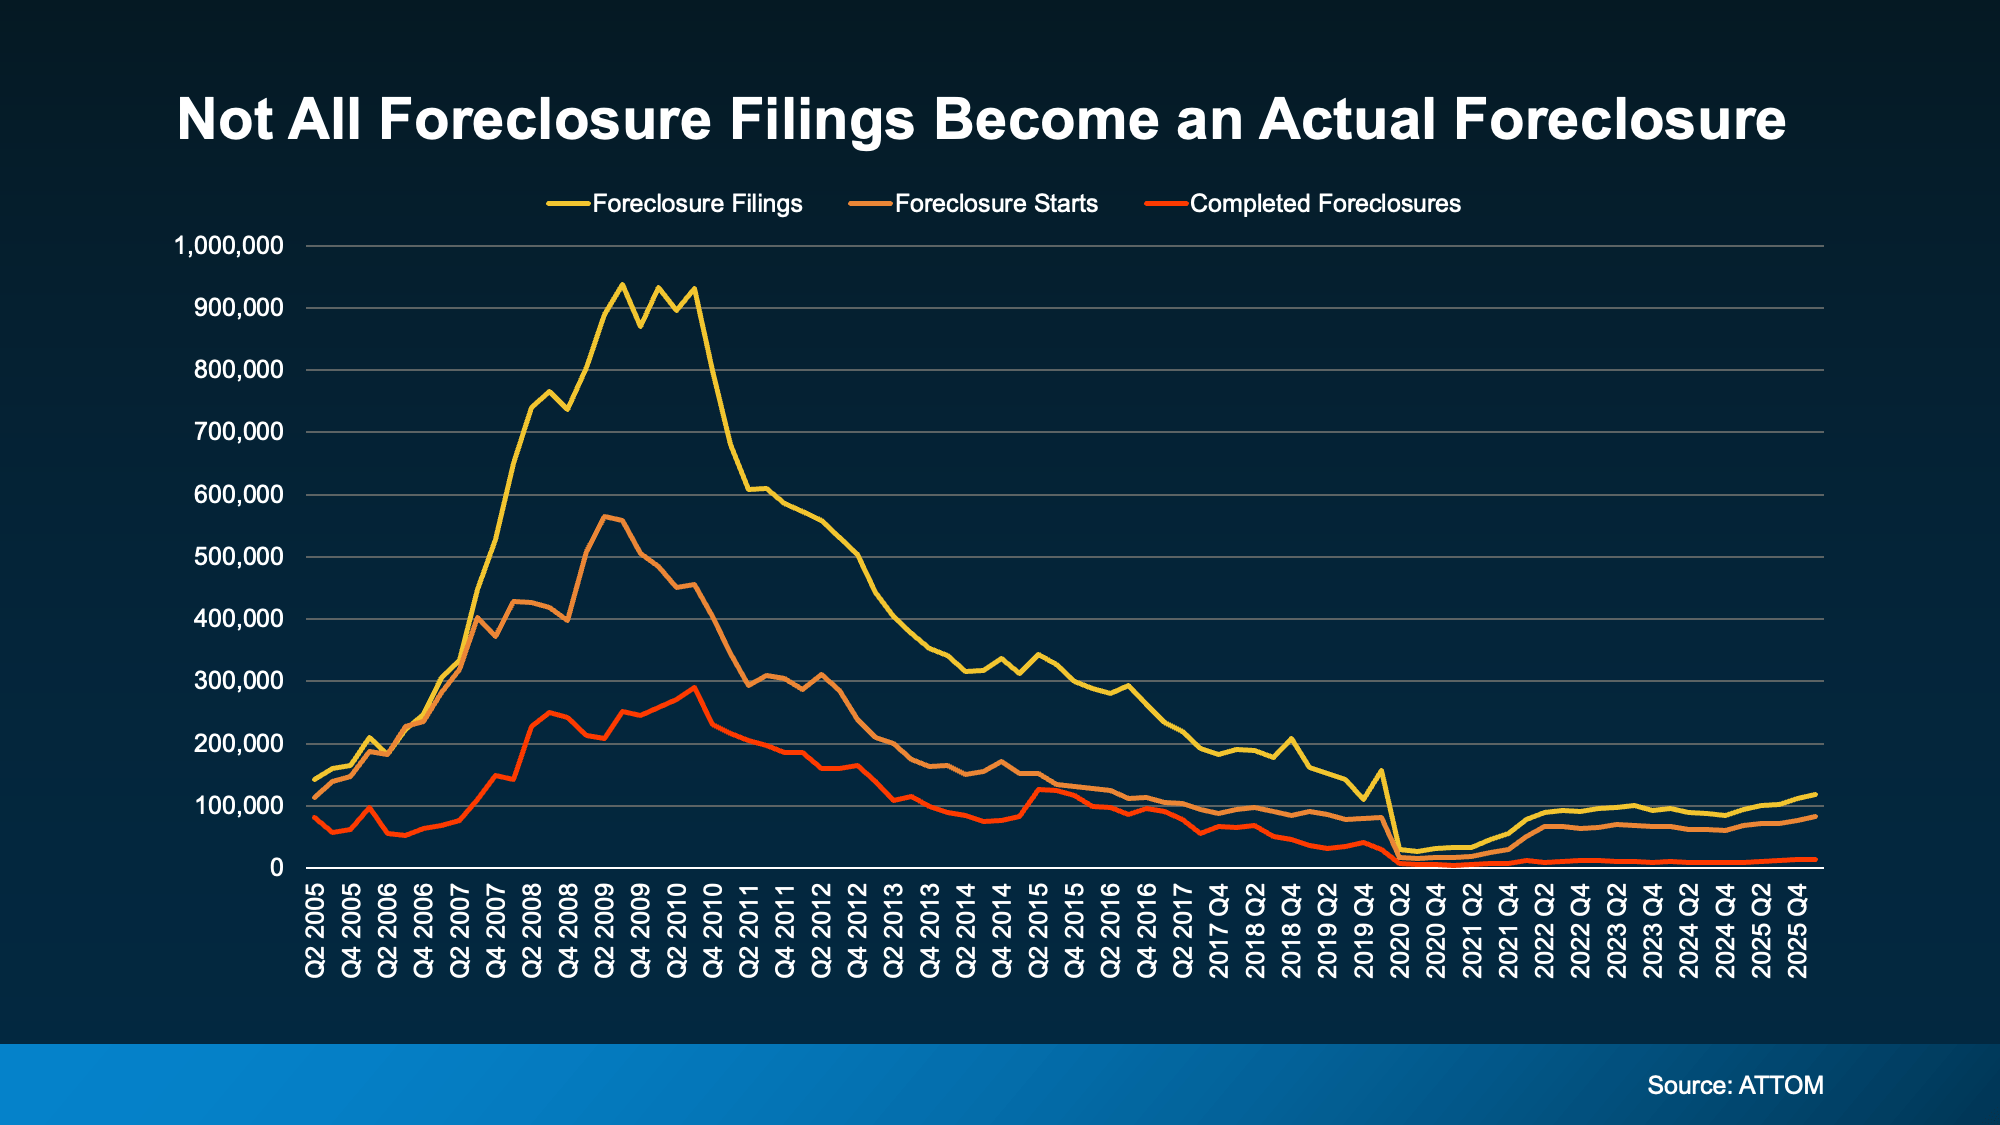
The red line consistently stays much lower than the other two. That gap matters.
It shows that many homeowners find alternatives before foreclosure is finalized, whether through repayment plans, loan modifications, selling their home, or other solutions.
That’s one of the biggest differences between today’s market and the 2008 crash.
Equity Is the Biggest Difference Between Now and 2008
One of the strongest protections homeowners have today is equity.
According to Cotality, the average homeowner is sitting on roughly $295,000 in equity.
That changes everything.
Back in 2008, many homeowners were underwater, meaning they owed more than the home was worth. Selling wasn’t an option for many people because the sale wouldn’t cover the mortgage balance.
Today, most homeowners are in the opposite position.
Even if someone experiences financial hardship, many have enough equity to:
- Sell the home
- Pay off what they owe
- Avoid foreclosure
- Protect their credit
- Potentially walk away with cash remaining
That creates far more flexibility and far fewer forced foreclosures.
Lending Standards Are Much Stronger Today
Another major difference between today and the housing crash is how mortgages are issued.
Leading up to 2008, lending standards were extremely loose. Many borrowers were approved for loans they realistically couldn’t afford.
Today’s buyers typically go through:
- Income verification
- Credit checks
- Debt-to-income analysis
- Stricter underwriting requirements
That means homeowners today are generally more financially qualified than buyers during the housing bubble years.
The market simply isn’t built on the same risky foundation it was back then.
What Homeowners Should Know If They’re Struggling
If you’re behind on payments or worried about keeping up with your mortgage, it’s important to know you likely have more options than you think.
Foreclosure is usually considered a last resort by lenders because it’s expensive and time-consuming for them as well.
Depending on your situation, options may include:
Repayment Plans
Your lender may allow you to catch up on missed payments over time instead of requiring one large payment upfront.
Forbearance
This temporarily reduces or pauses mortgage payments during short-term hardship.
Loan Modification
Your lender may adjust the loan terms to create a more manageable monthly payment.
Selling the Home
If you have equity, selling may allow you to pay off the mortgage and preserve your financial position before foreclosure progresses further.
The key is acting early.
The sooner homeowners communicate with their lender or speak with a real estate professional, the more potential solutions are usually available.
Why This Matters for Buyers and Sellers
For buyers waiting for a massive foreclosure wave to crash home prices, current trends don’t support that expectation.
Inventory has improved in many markets, but foreclosure activity remains historically low compared to true distress periods.
For sellers, this is also an important reminder that the housing market remains far more stable than many headlines imply.
Media coverage often focuses on dramatic percentages without providing historical context. A rise from unusually low pandemic-era numbers doesn’t automatically equal a housing crisis.
What This Means for The Woodlands Housing Market
In The Woodlands and surrounding areas, homeowner equity and continued buyer demand have helped keep the market relatively stable compared to what was seen during the last housing crash.
While every homeowner’s situation is unique, the broader market conditions today are significantly healthier than they were during the Great Recession.
At The McClung Group, we believe informed homeowners make better decisions. Whether you’re concerned about the market, exploring your options, or simply trying to understand what today’s headlines actually mean, having the right information matters.
Final Takeaway
Foreclosure filings may be rising, but context matters.
Today’s housing market looks very different from 2008 because homeowners have substantially more equity, lending standards are stronger, and most foreclosure filings never become completed foreclosures.
This isn’t a repeat of the housing crash. It’s a market gradually returning to more normal levels after several years of unusually low foreclosure activity during the pandemic.
If you have questions about your home equity, your options as a homeowner, or what’s happening in today’s market, The McClung Group is here to help.
Whether you’re considering selling, navigating financial uncertainty, or simply want a better understanding of your local market, reach out to our team for guidance tailored to your situation.

Tiffany McClung
Realtor and Team Leader | The McClung Group | Keller Williams The Woodlands & Magnolia
or another way